01PUBLIC WEBSITE + DASHBOARD↗
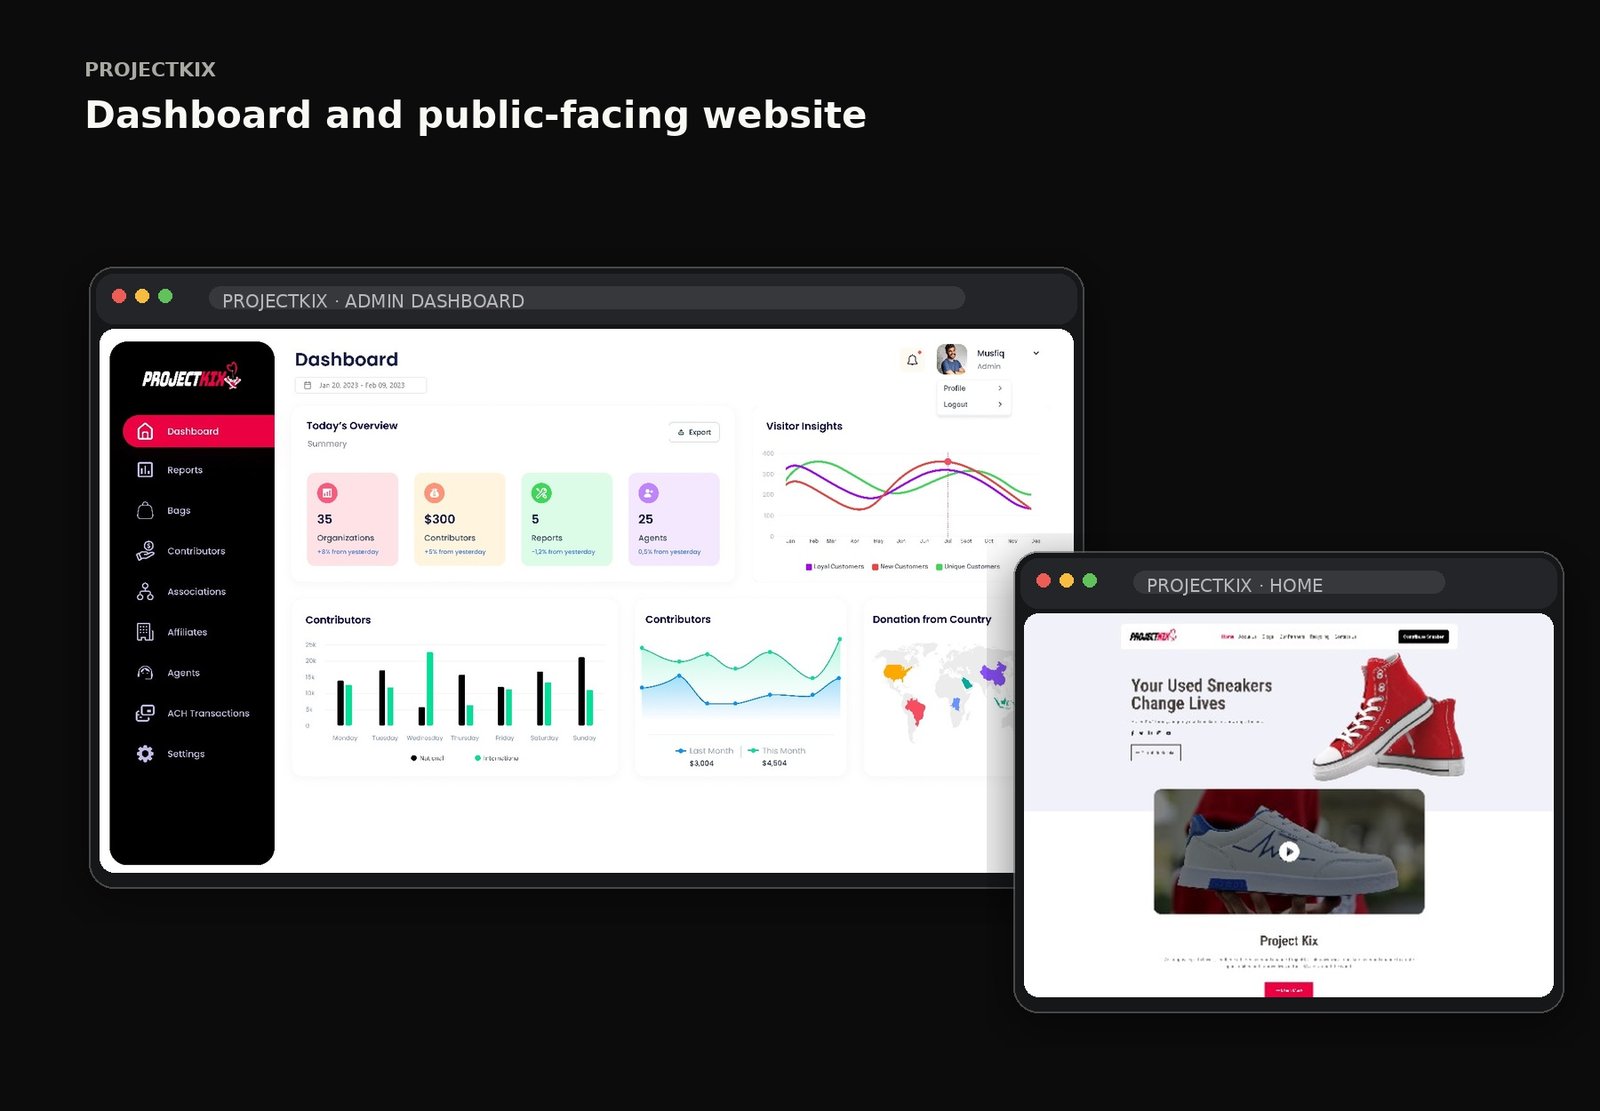
A public-facing sneaker-reuse experience paired with an operational dashboard for managing contributors, bags and impact workflows.
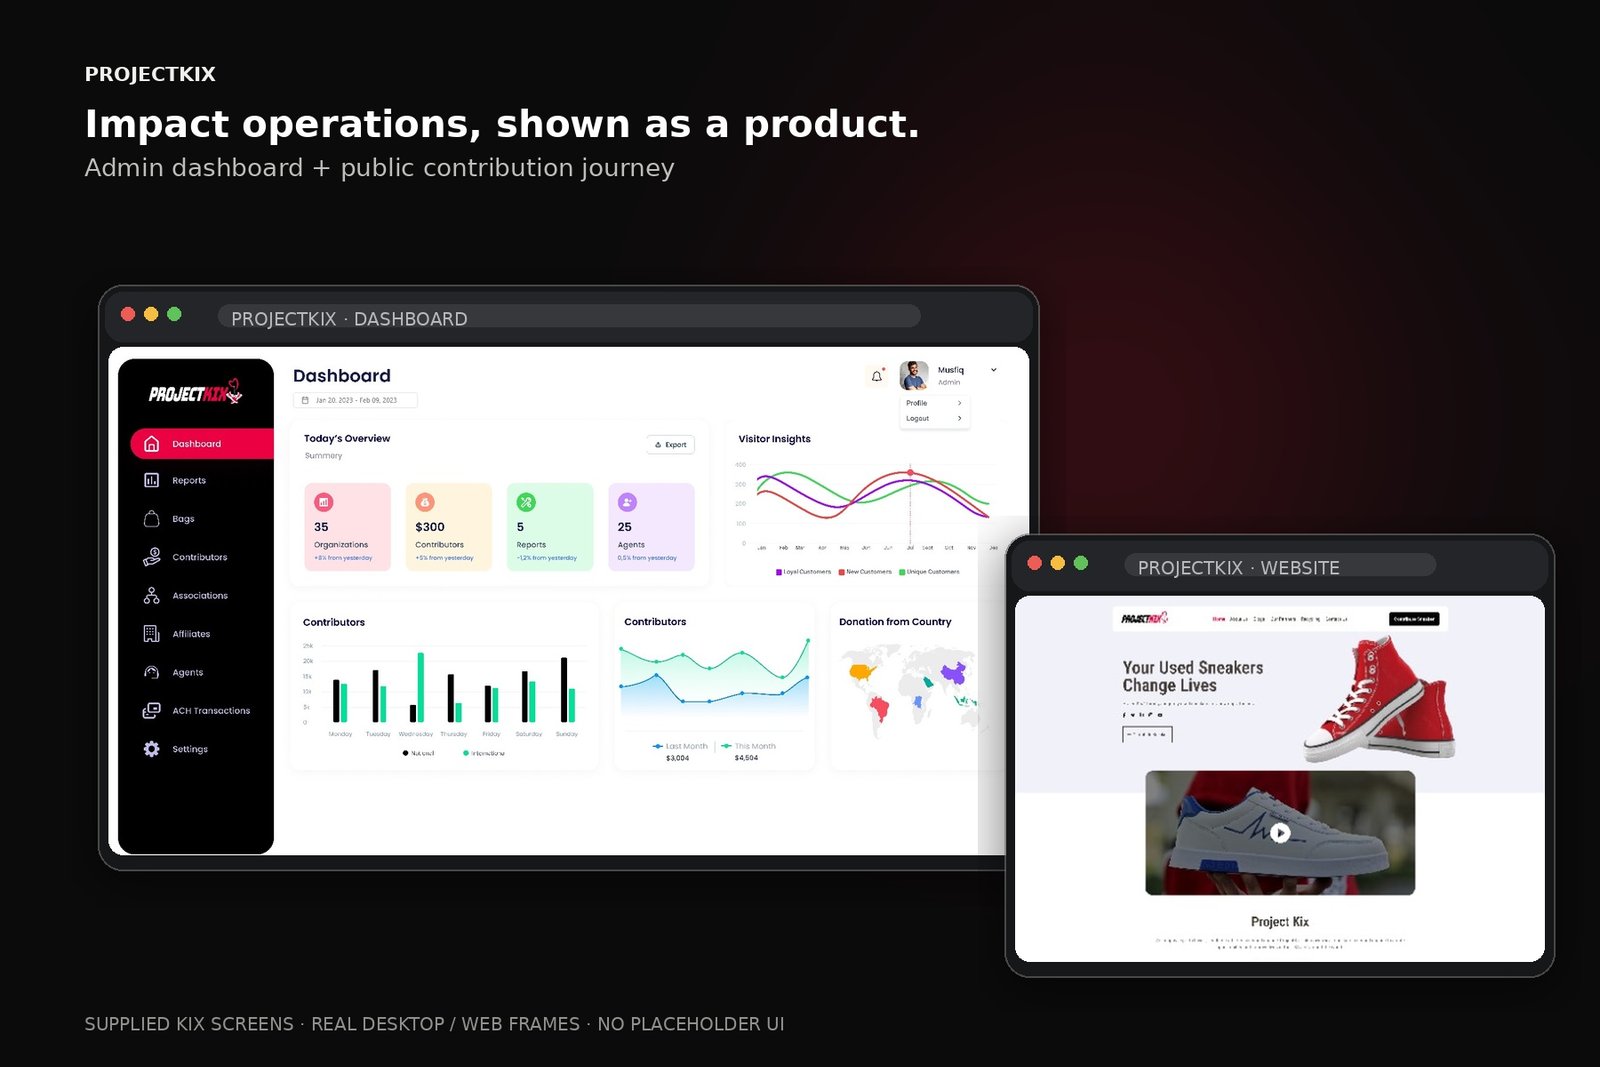
The supplied public website and operational dashboard are kept as desktop experiences rather than forced into mobile frames.
The supplied ProjectKix material includes a public website and an administrative dashboard. The public experience explains the contribution journey and impact story, while the dashboard organizes operational areas such as contributors, bags, associations, affiliates and transactions.
Before shaping the interface, the work is framed around the user's mental model, moments of friction and the opportunities that can change the journey.
The public site needs a clear reason to participate before introducing operational detail.
The contribution journey benefits from a small number of understandable steps.
The dashboard needs entity-based navigation because operational work spans several connected records.
Public impact story competing with calls to action
Multiple operational entities to manage
Dense dashboard data can become difficult to scan
Make the contribution journey visually sequential
Use impact and process storytelling to build confidence
Organize dashboard navigation around operational entities and tasks
The interface follows a clear information hierarchy so visual polish supports the product model rather than hiding it.
If the public story reduces the contribution journey to clear steps and the dashboard organizes operational data around recognizable entities and tasks, the system can feel approachable on both sides.
The journey is intentionally expressed as a sequence of decisions, not a list of screens. This keeps the case study about behavior and product thinking.
Create a clear narrative from the mission to the action required from a contributor.
Translate the administrative workload into recognizable dashboard areas and a scannable overview.
Make operational states understandable through consistent tables, cards, reports and transaction surfaces.
Use a strong red, black and white visual identity consistently across public and operational surfaces.
These are the decisions that make the final interface feel coherent rather than merely polished.
Keep the public story human and action-oriented.
Use clear step sequencing for contribution.
Group operational navigation by the entities teams actually manage.
Use status and hierarchy to make dense dashboard information scannable.
Instead of designing each screen independently, repeated behavior becomes a system. That gives future screens the same rhythm and makes implementation more predictable.
Narrative is based on the supplied ProjectKix website/dashboard screens and public project context; no unsupported impact metrics are claimed.